To provide you with the best experience, cookies are used on this site. Learn more

To provide you with the best experience, cookies are used on this site. Learn more

To build your own Itinerary, click  to add an item to your Itinerary basket.
Already saved an Itinerary?


Destination Performance
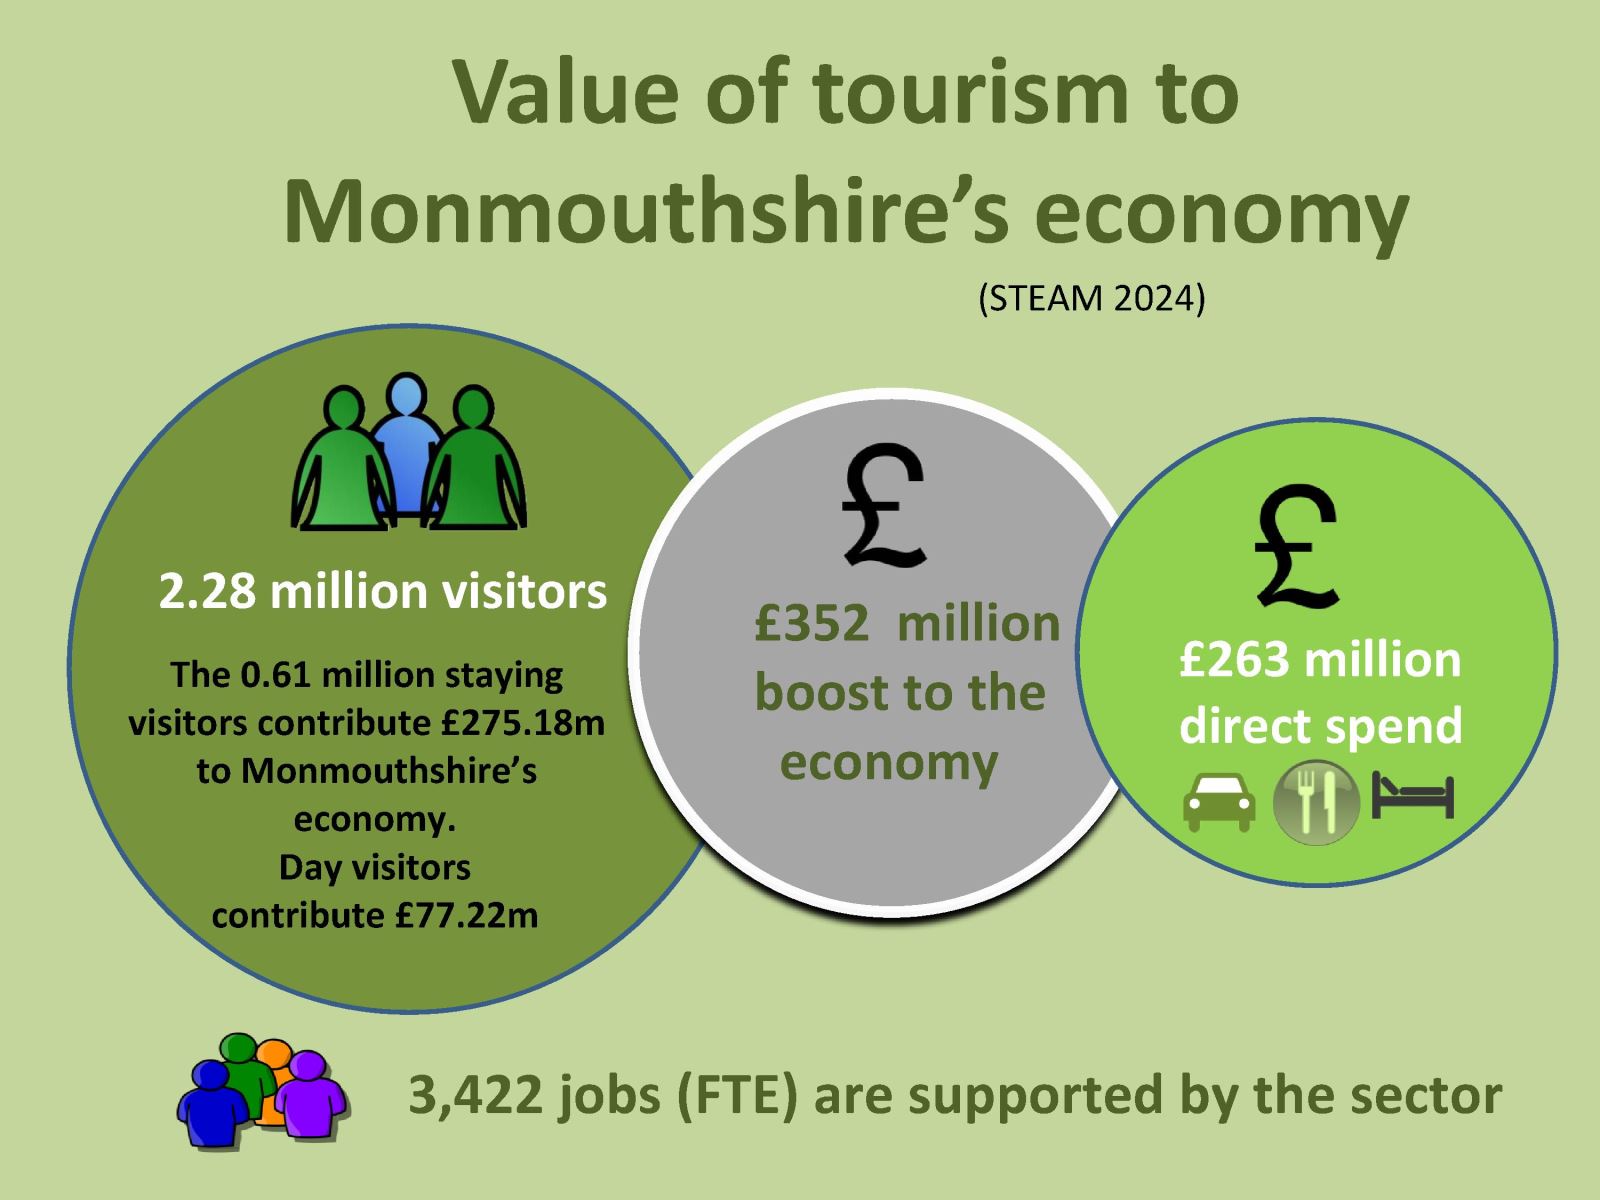
In 2024, 2.28 million visitors came to Monmouthshire, spending 3.53m visitor days in the county, generating more than £352 million benefit for the local economy, and supporting 3,422 full time equivalent (FTE) jobs. (Approximately 15% of Monmouthshire jobs are supported by tourism spend).
2024 STEAM figures show continued recovery of Monmouthshire's visitor economy post pandemic with the economic impact of tourism increased by 1.9% and the economic impact per visitor day increased by 6.9% compared with 2023. Total visitor numbers were down -0.4% and full time equivalent jobs decreased by -1.1% compared with 2023.
Tourism delivers a wide range of benefits for Monmouthshire, including the generation of visitor spend to support rural services and high streets, maintain local heritage, and sustain a diverse programme of events, experiences and and year-round employment opportunities for the benefit of locals.
Place branding also has a significant impact on the way the area is perceived by its residents and visitors and these perceptions have a very real effect on its attractiveness for investment and the quality of life for its citizens (including resident satisfaction, civic pride, access to cultural and leisure activities and employment etc, which impact on health and wellbeing).
Monmouthshire 2024 STEAM headlines:
% change for Monmouthshire compared with the SE Wales averages* (2023-2024):
Economic impact (% change) +1.9% (+0.8% South East Wales average)
Visitor numbers (% change) -0.4% (+2.1% South East Wales average)
Visitor Days (% change) +0.1% (+2.4% South East Wales average)
FTEs (% change) -1% (+0.6% South East Wales average)
Economic impact per visitor day £99.75 (+1.9%) (£82.63 South East Wales average (+0.8%)
Monmouthshire and Wales tourism performance is measured using STEAM (Scarborough Tourism Economic Activity Monitor).
Download 2024 STEAM summary, the infographic and full report.
Download 2023 STEAM summary, the infographic and full report.
Download 2022 STEAM summary, the infographic and full report.
Download 2021 STEAM summary, the infographic and full report.
Download 2020 STEAM summary, the infographic and full report.
Download 2019 STEAM summary, the infographic and full report.
Previous STEAM reports are available upon request.
Destination Surveys
2019 Monmouthshire Visitor Survey Report
2016 Monmouthshire Visitor Survey Report
2016 Wye Valley Visitor Survey Report
Stakeholder Feedback Infographic
RDP Vale of Usk Visitor Information Review (March 2018)
Covid-19 Impact on Tourism Wales Summary (April 2020)
Association of Leading Visitor Attractions Covid-19 Recovery Tracker Research
Destination Bedstock Maps
As part of our annual STEAM survey we review all the visitor accommodation on offer in Monmouthshire. We then put this accommodation into mapping software (removing all identifying data).
© Visit Monmouthshire 2026. All Rights Reserved